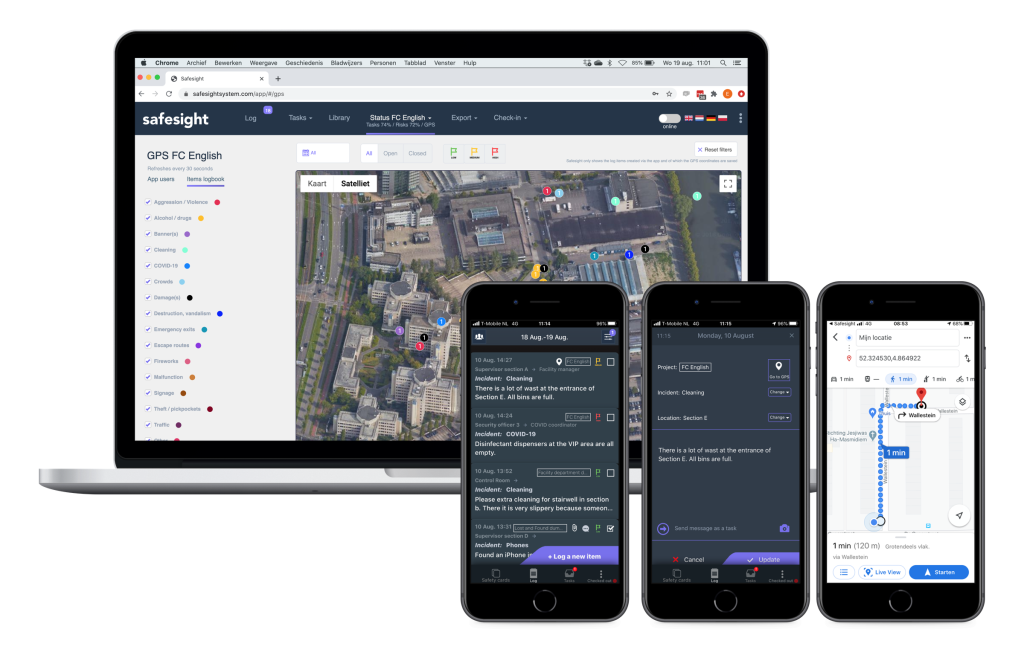
1. Display your logbook items on a map
From this dashboard, the logs whose GPS location has been saved are displayed on a map. The logs are divided according to their incident code.
Via filters it is possible to display a day, a period, several days or all logbook items. A “Status” and “Priority filter” is also available.
With this functionality, users can visualize over a period of time which types of issues have been reported in an area (and what the status of those issues is). Think of complaints, (possible) dangerous situations, crowds, reports of waste, etc.
With the new release, it is also possible to navigate via the Safesight app to the location of a logbook item – whose GPS coordinates have been saved.
2. Log: save filter settings
The filter settings of the log page (of the browser version) are saved. When a user navigates from the log to another page within Safesight, and then returns to the log page, the filters are still active.
3. Improvements Risk Dashboard
In the Risk dashboard, the topics on which the organization runs an increased risk are now standard at the top.
4. Additional log filter setting: Priority
Log reports can now also be filtered based on their priority.
More information?
Would you like to experience how the Safesight safety management software can work for your organization? Leave your details here for a demo.


